> ## Documentation Index
> Fetch the complete documentation index at: https://lightdash-mintlify-b81a581c.mintlify.site/llms.txt
> Use this file to discover all available pages before exploring further.
# Treemap chart
> Use treemap charts to show parts of a whole using nested rectangles.
Treemaps show parts of a whole using nested rectangles. Each rectangle's size represents the value of a metric, and dimensions define how the data is grouped and nested. You can use a single dimension or multiple and they will work as described below.
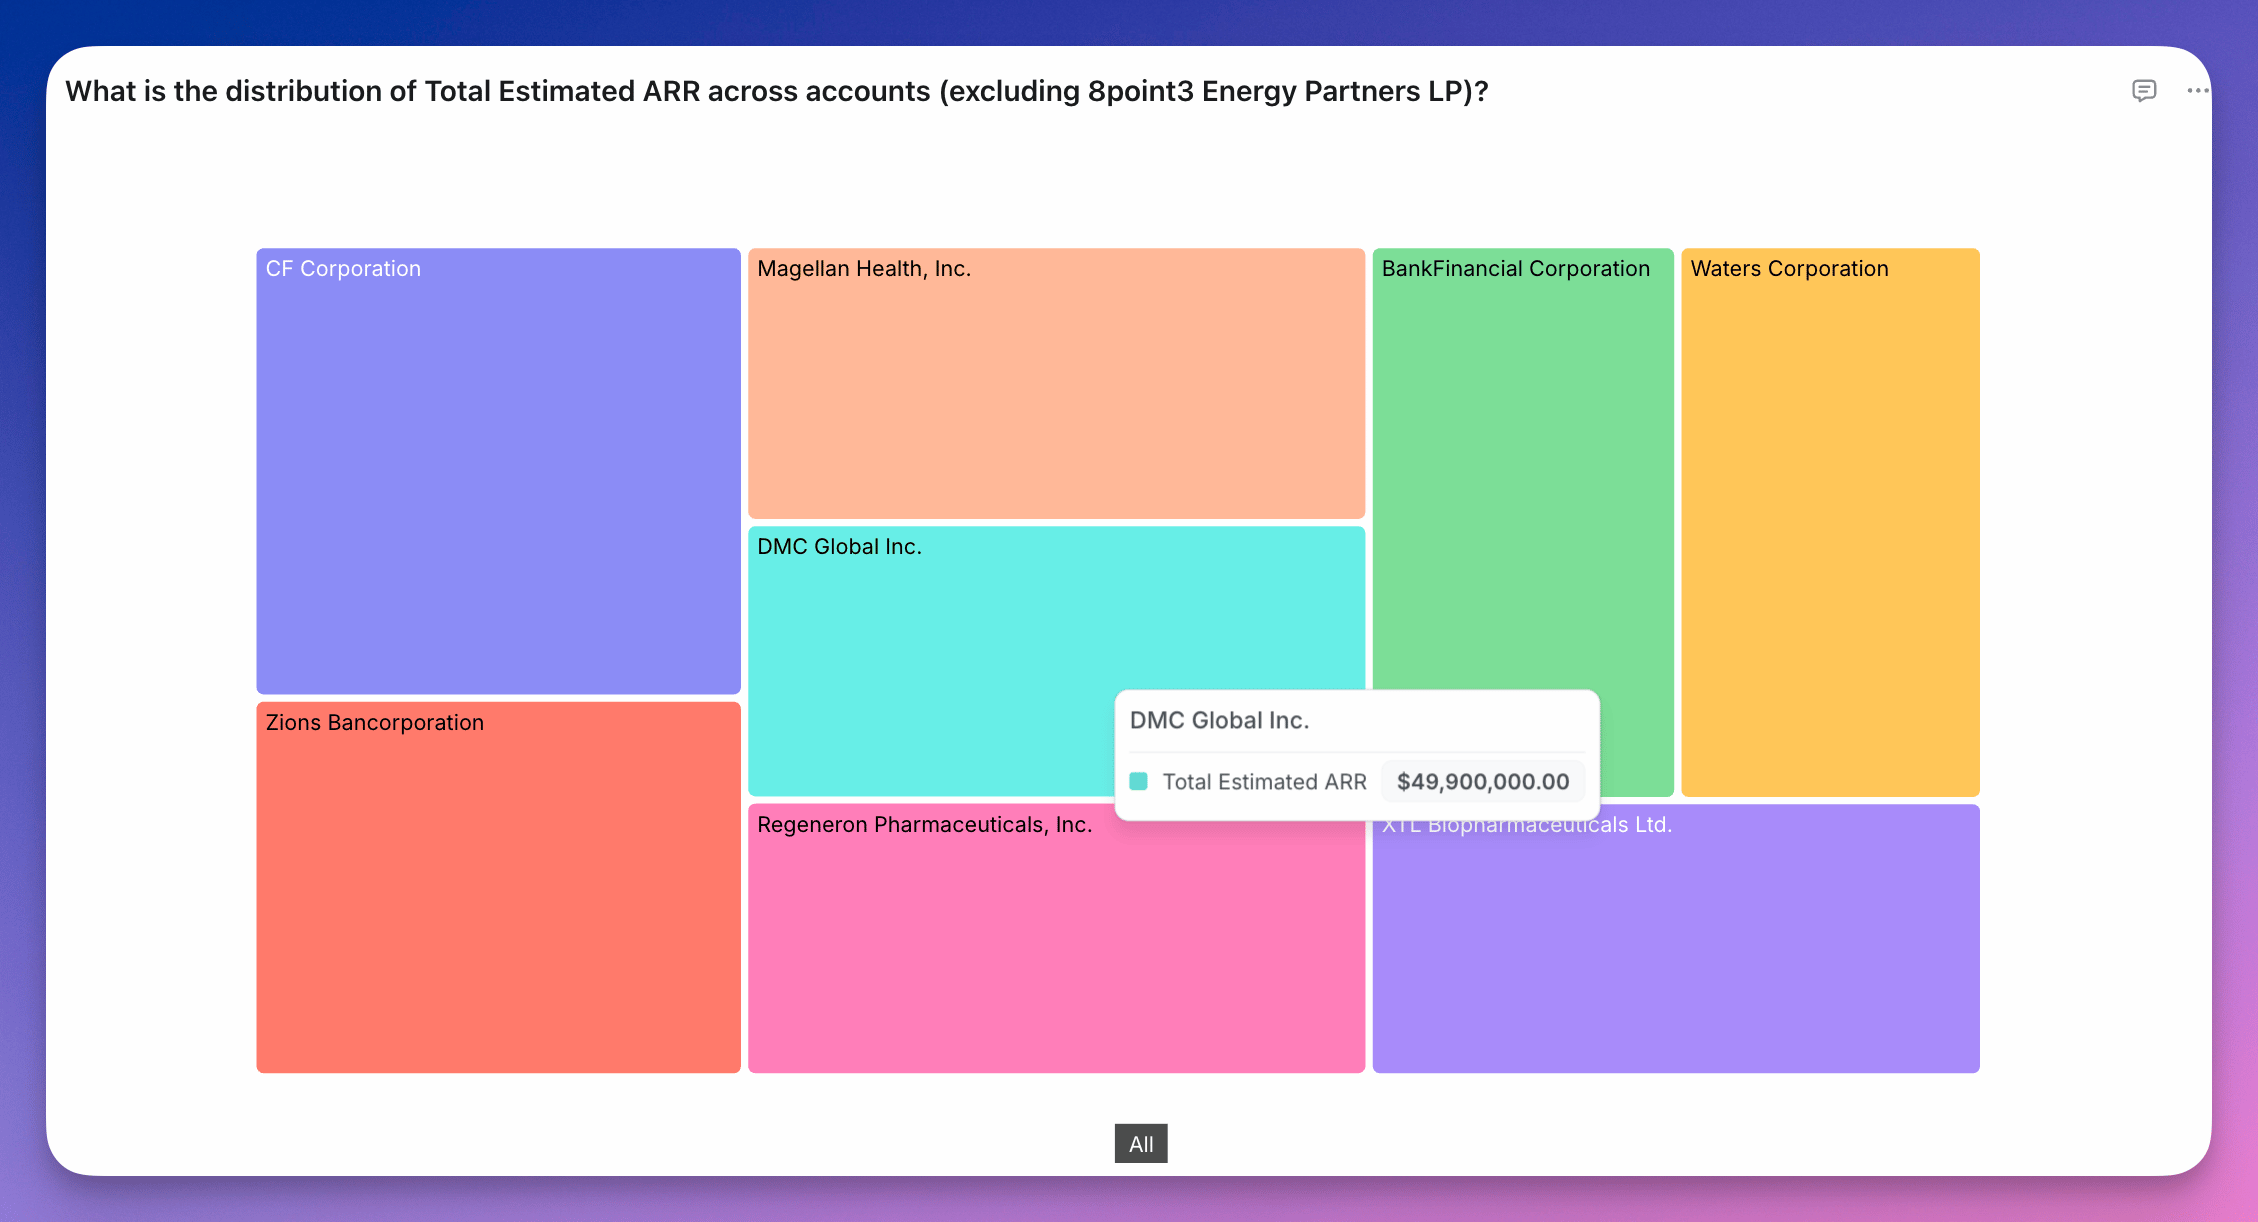
**One dimension**: Each category becomes a rectangle, sized by the metric value.
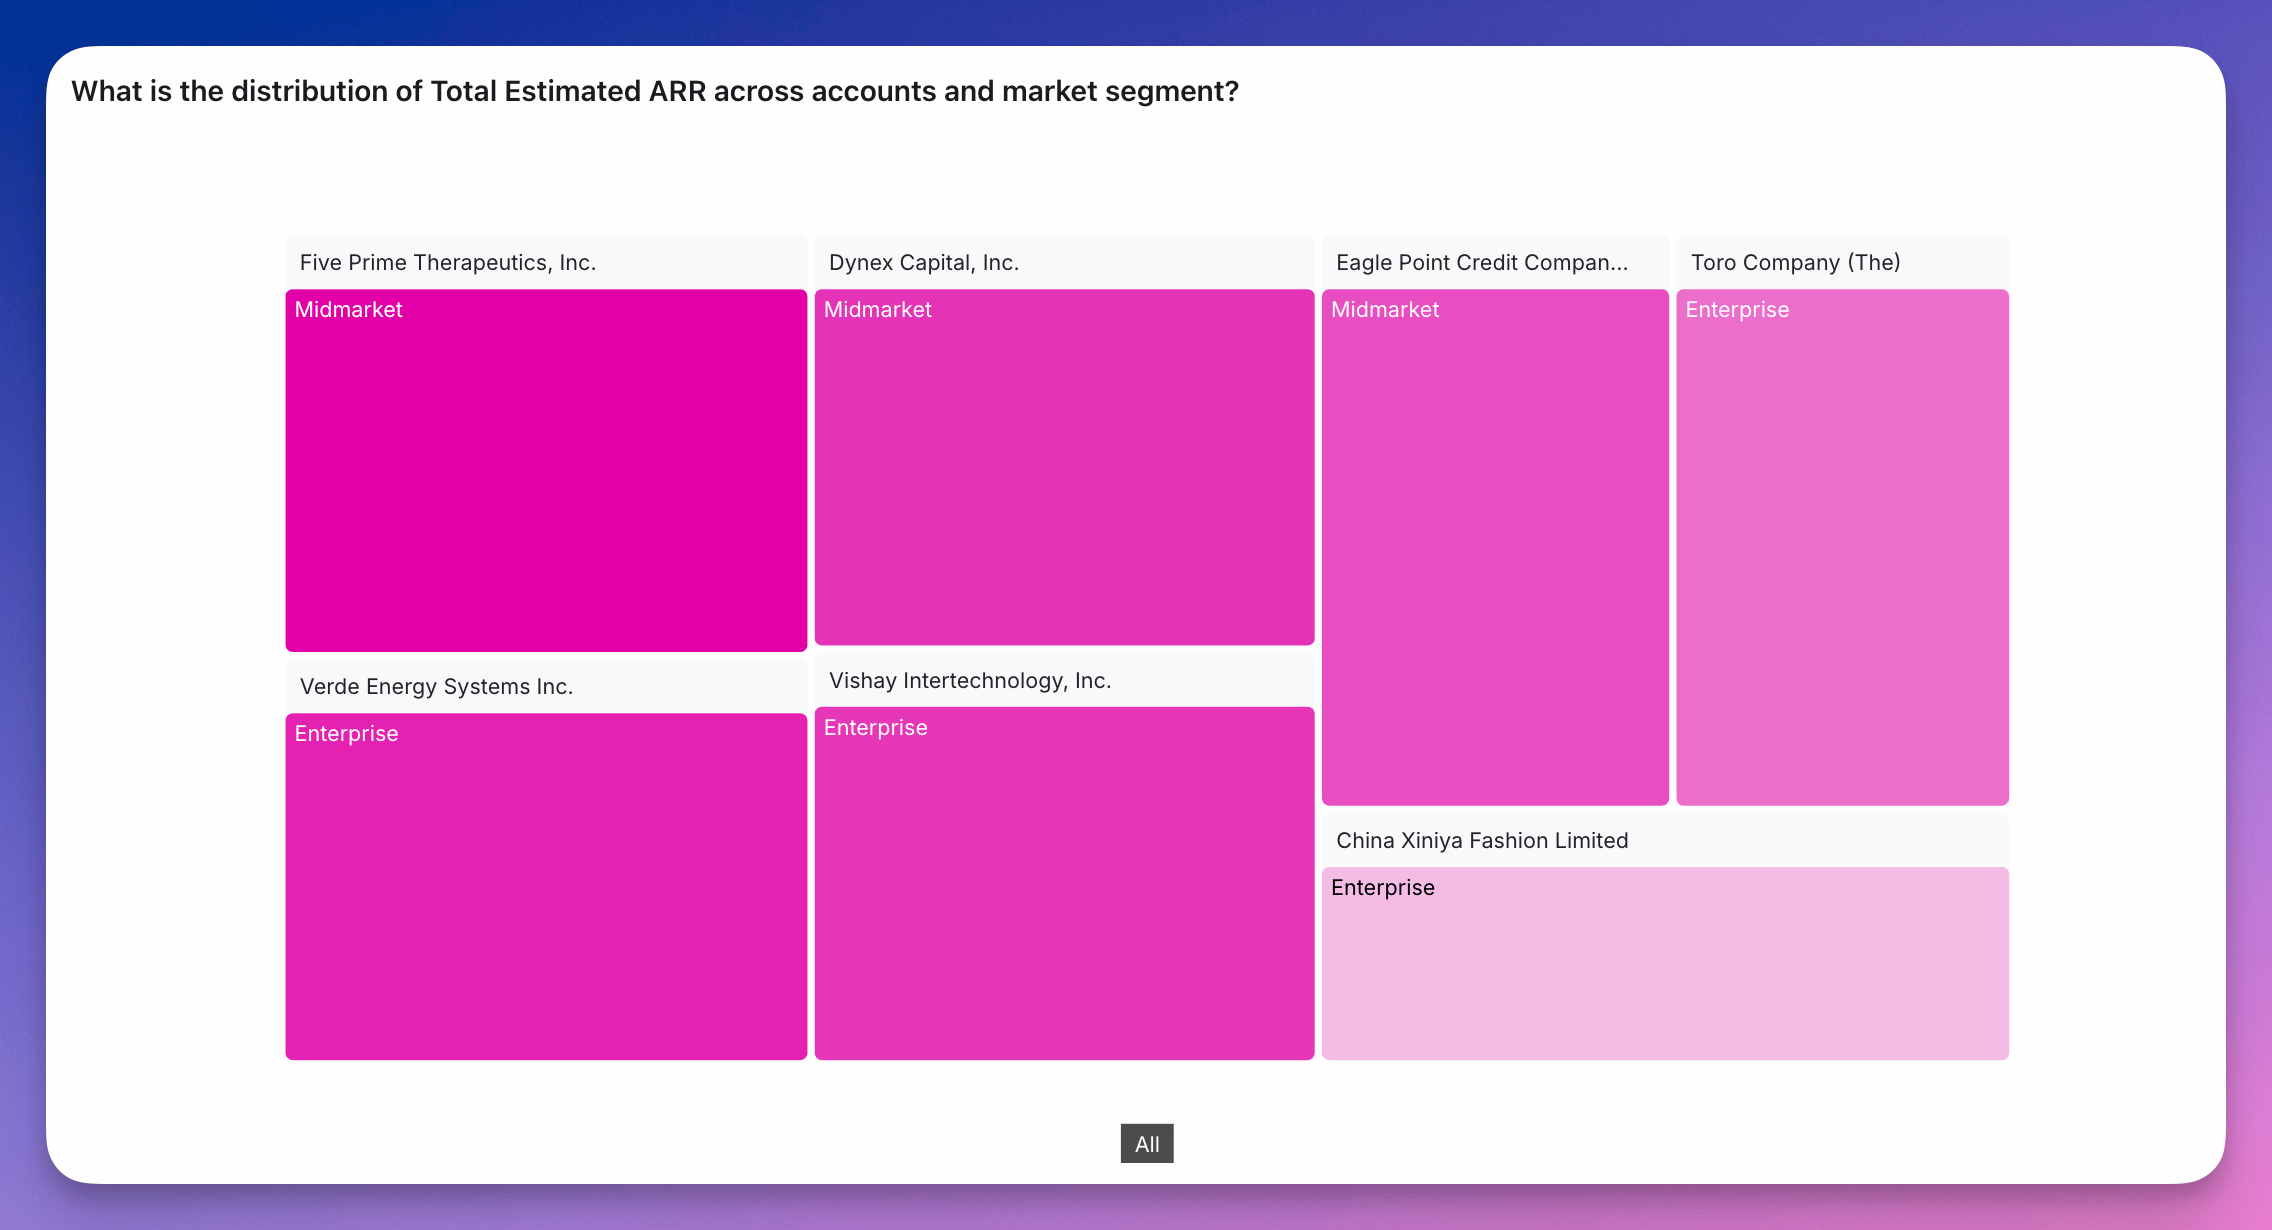
 **Two dimensions**: Creates a hierarchy where each rectangle is split into sub-rectangles based on the second dimension.
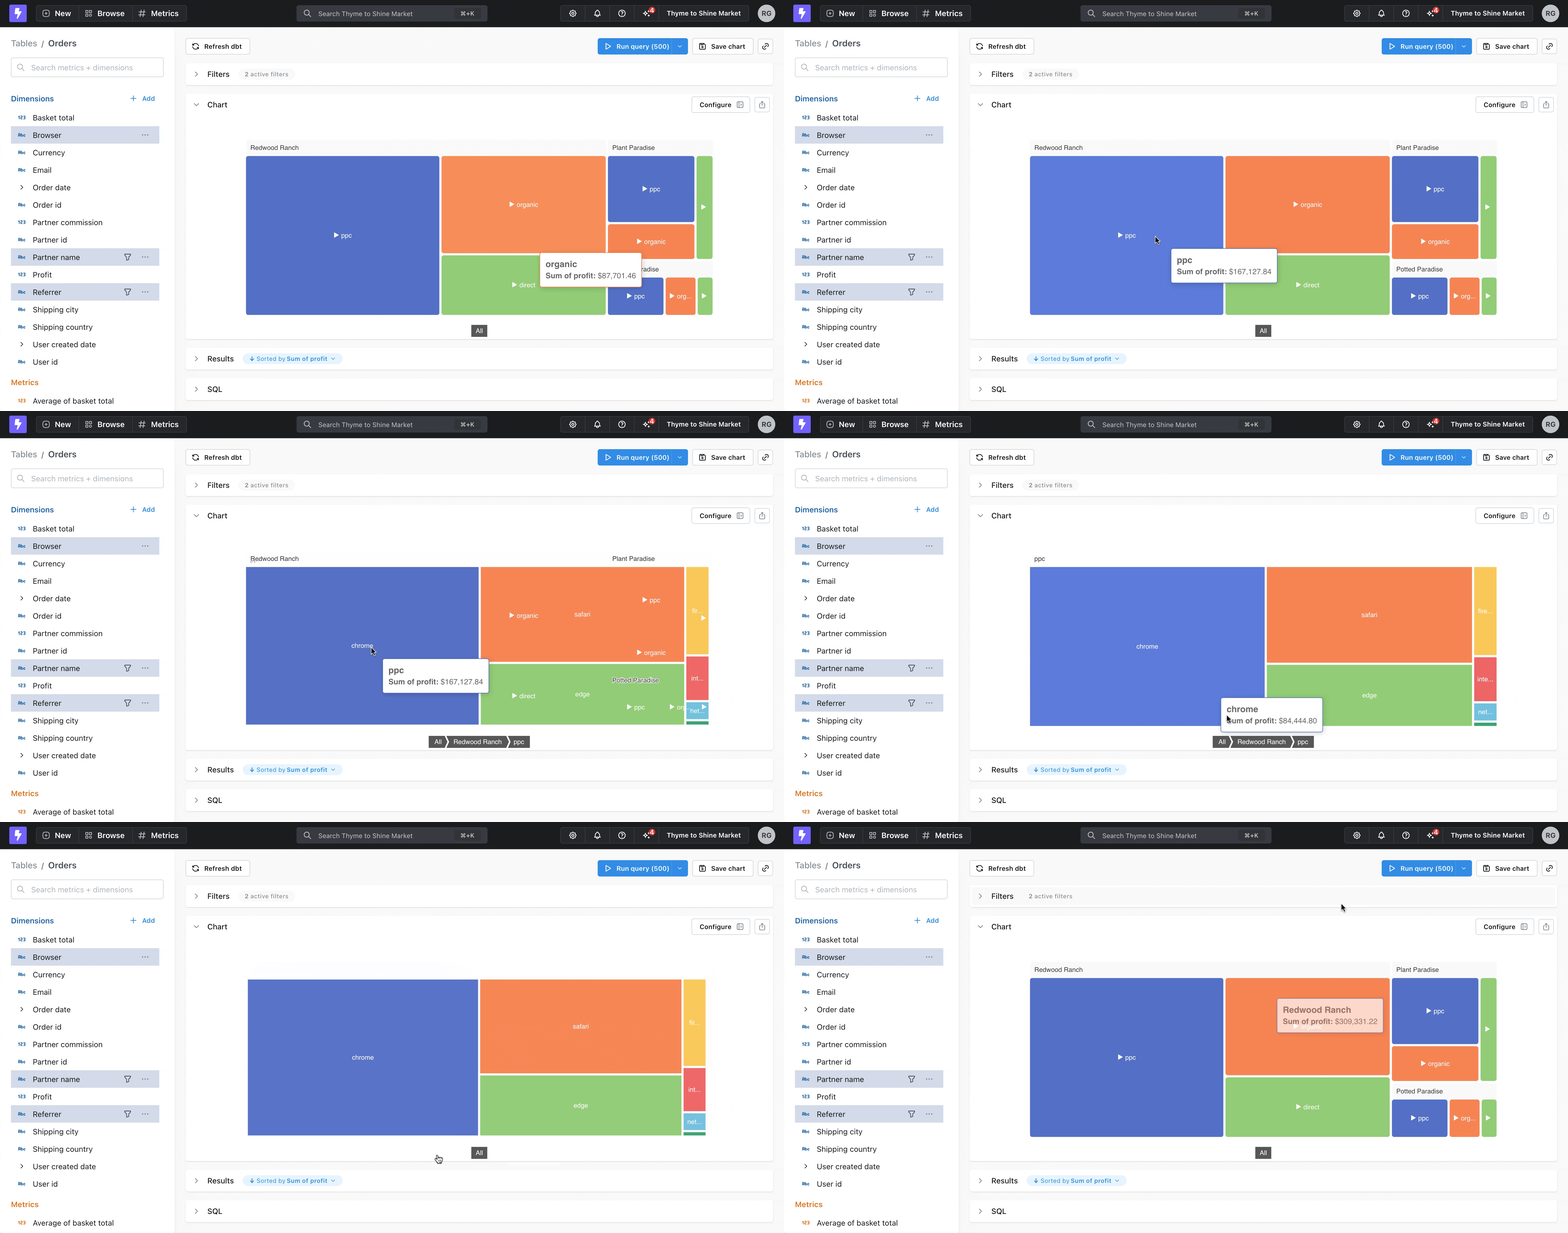
 **Three or more dimensions**: The chart displays the top-level hierarchy. Users can click to drill down into deeper layers.
 Treemaps are useful when:
* You want to compare proportions across categories
* You're visualizing hierarchical data
* Space is limited and you want a compact alternative to bar or pie charts
To create a treemap, select **Treemap** as the chart type and choose your dimensions.
## Layout
* **Dimension hierarchy** tells Lightdash how to group or nest the dimensions.
* **Size metric** determines how large each section of the treemap chart is.
* **Color metric** allows you to set a color scale for Highlighting each section of the treemap.
## Display
* **Minimum section size** determines when to start hiding sections, anything smaller than this size can be shown by zooming in.
* **Max leaf depth** allows you to choose when a user needs to start drilling into sections to see the next tier, default value is 2.
Treemaps are useful when:
* You want to compare proportions across categories
* You're visualizing hierarchical data
* Space is limited and you want a compact alternative to bar or pie charts
To create a treemap, select **Treemap** as the chart type and choose your dimensions.
## Layout
* **Dimension hierarchy** tells Lightdash how to group or nest the dimensions.
* **Size metric** determines how large each section of the treemap chart is.
* **Color metric** allows you to set a color scale for Highlighting each section of the treemap.
## Display
* **Minimum section size** determines when to start hiding sections, anything smaller than this size can be shown by zooming in.
* **Max leaf depth** allows you to choose when a user needs to start drilling into sections to see the next tier, default value is 2.